Adding custom web analytics
The system allows you to track custom events as web analytics and display the results in reports within the administration interface.
Logging analytics in custom code
Developers can use the Xperience API to log web analytics anywhere within the website’s code. This is possible for both the default web analytics statistics, as well as custom statistics representing any type of event that you wish to track.
To log web analytics, use the IAnalyticsLogger service (available in the CMS.WebAnalytics namespace). The service provides the following methods:
- Log* – methods that log hits for the system’s default statistics, for example LogPageView (every statistic has a corresponding method).
- LogCustomAnalytics – logs custom statistics under a specified name.
All of the methods require an AnalyticsData parameter, which specifies information about the context in which the analytics are logged. The following are the most important properties available. You can set the properties through constructor parameters when creating a new AnalyticsData object:
- SiteID – the identifier of the site for which the event is logged.
- ObjectName / ObjectID – specifies the context in which the hit was logged. You can use the name or ID of an object, or any custom string. For example, when logging the default page view statistic, the system stores the URL of the current page as the ObjectName.
- Hits – sets the amount of hits added to the statistic. This parameter is optional and the default value (1) is used if not specified.
- Value – specifies a special value for the hit. This parameter is optional and can be used to assign weight to the hit according to some conditions. The value of a statistic is cumulative, which means that each hit adds to the total value logged for the given analytics record (specified by the ObjectName or ObjectID).
- Culture – specifies the culture code under which the system logs the event. This parameter is optional, and the hit is logged without a culture context if not specified.
See the example below to learn more.
Example
The following example demonstrates how to log a basic button click as a custom web analytics statistic. You can use the same approach to implement tracking for any type of event on your website.
Logging the event
Implement the MVC code that presents the button and handles clicks:
Open your live site project in Visual Studio.
Create a new controller class or edit an existing one.
Add an action that handles button click requests (for example as a POST action). Use the IAnalyticsLogger service to log a custom analytics hit.
Exampleusing System.Web.Mvc; using CMS.Base; using CMS.WebAnalytics; public class HomeController : Controller { // Instance of the web analytics logging service private readonly IAnalyticsLogger analyticsLogger; // Instance of a service used to get the name of the current site private readonly ISiteService siteService; // Example of a controller constructor that initializes service instances using dependency injection public HomeController(IAnalyticsLogger analyticsLogger, ISiteService siteService) { this.analyticsLogger = analyticsLogger; this.siteService = siteService; } public ActionResult Index() { return View(); } [HttpPost] [ValidateAntiForgeryToken] public ActionResult ButtonClick() { // String that indicates whether the current user is authenticated string authStatus = "public"; if (User.Identity.IsAuthenticated) { authStatus = "authenticated"; } // Prepares an object representing the logging context AnalyticsData data = new AnalyticsData(siteService.CurrentSite.SiteID, objectName: authStatus, hits: 1, value: 1); // Logs a web analytics hit for the 'buttonclicked' custom statistic analyticsLogger.LogCustomAnalytics("buttonclicked", data); return RedirectToAction("Index"); } }Add a button element to the view displayed by the adjusted controller (an Index view based on the sample code above):
 @using (Html.BeginForm("ButtonClick", "Home"))
 {
     @Html.AntiForgeryToken()
     <input type="submit" value="Custom click" />
 }
Save the changes and Build your solution.
When a user clicks the button, the API logs an analytics hit. The resulting data stores the amount of clicks and indicates whether the user who clicked the button was authenticated. Once the data is stored in the database, it can be loaded and displayed in the Web analytics application.
Open the corresponding page on the live site and click the Custom click button several times. Try doing this while signed in and also as an unauthenticated public visitor.
Creating reports for statistics
Before users can view the statistics of the button click event in the Web analytics application, you need to create reports for displaying the data of the custom statistic. Most statistics have five types of reports: hourly, daily, weekly, monthly and yearly.
Open the Reporting application and select the Web Analytics category in the tree.
- The sub‑categories contain reports used by the default statistics such as page views, traffic sources, etc.
Click … next to the New report button above the tree and select New category in the menu.
Type Button clicks as the Category display name and click Save.
Create a daily report for the new statistic. Click New report and enter the following values:
Report display name: Button clicked - daily report
Report name: buttonclicked.dayreport
The names of the reports must use a specific format:
- <statistic code name>.hourreport
- <statistic code name>.dayreport
- <statistic code name>.weekreport
- <statistic code name>.monthreport
- <statistic code name>.yearreport
In this example, the code name of the custom statistic is buttonclicked, as defined above in the controller code.
Click Save.
Switch to the Parameters tab of the new report and use the New field button to create three essential parameters, which the web analytics use internally:
Field name: FromDate
Data type: Date and Time
Display field in the editing form: no (cleared)
Click Save for every parameter before moving on to the next one.
Field name: ToDate
Data type: Date and Time
Display field in the editing form: no (cleared)
The FromDate and ToDate parameters above define a time interval used to limit which data of the statistic is loaded. Only hits that occurred during the specified interval will be displayed in the report. The values of these parameters can be set by users when viewing the data of the statistic in the web analytics interface.
Field name: CodeName
Data type: Text
Size: 20
Default value: buttonclicked (the code name of the displayed statistic in general)
Display field in the editing form: no (cleared)
The system uses the CodeName parameter to identify from which statistic the report loads data. The value is usually not modified if the report is dedicated to a single statistic (like the one in this example).
Go to the General tab and click New in the Tables section below the layout editor. Fill in the table’s properties as shown below:
Display name: Table
Code name: Table_ButtonClicked_Day
Query:
  SET @FromDate = dbo.Func_Analytics_DateTrim(@FromDate,'day');
  SET @ToDate = dbo.Func_Analytics_EndDateTrim(@ToDate,'day');

  SELECT StatisticsObjectName as 'Authentication status', SUM(HitsCount) as 'Hits'
  FROM Analytics_Statistics, Analytics_DayHits
  WHERE (StatisticsSiteID = @CMSContextCurrentSiteID)
  AND (StatisticsCode = @CodeName)
  AND (StatisticsID = HitsStatisticsID)
  AND (HitsStartTime >= @FromDate)
  AND (HitsEndTime <= @ToDate)
  GROUP BY StatisticsObjectName
  ORDER BY SUM(HitsCount) DESC
The new report is a daily report, so the data of the table is retrieved from the Analytics_DayHits table, together with the Analytics_Statistics table. See Web analytics API for more information about the database table structure.
Trimming the values of the FromDate and ToDate parameters
The SET statements included in the query are necessary to ensure that the specified time interval includes the first and last units of time (e.g. the exact days entered into the From and To fields of a daily report).
The second parameter of the trimming functions must match the time unit of the given report. The options are: ‘hour’, ‘day’, ‘week’, ‘month’, ‘year’.
Click Save & Close to create the table.
Click Insert in the Tables section to add the new table into the report.
Click Save.
The daily report is now complete. In a real‑world scenario, the report would usually also contain a graph to display the data. See the Working with system reports chapter to learn more about graphs and other reporting options.
You can create the reports for the remaining time intervals using the same approach. The only differences should be in the names of the reports and tables, and the code of the queries, where you need to load data from the appropriate tables – Analytics_YearHits in the yearly report, Analytics_MonthHits in the monthly report, etc. You can make this process easier by using the Clone report () button in the menu above the report tree. Simply create copies of the daily report and then make the necessary adjustments.
Setting the title for custom statistics
To ensure that the administration interface displays an appropriate title for your custom statistic, you need to create a resource string:
- Open the Localization application.
- Click New string on the Resource strings tab.
- Enter the Key of the string in format: analytics_codename.<statistic code name> (analytics_codename.buttonclicked for this example)
- Type the text of the string for your system’s default culture, for example: Button clicks
- If you are using a multilingual UI, you can enter translations of the string for individual cultures.
- Click Save.
The system uses the string as the title for the matching statistic.
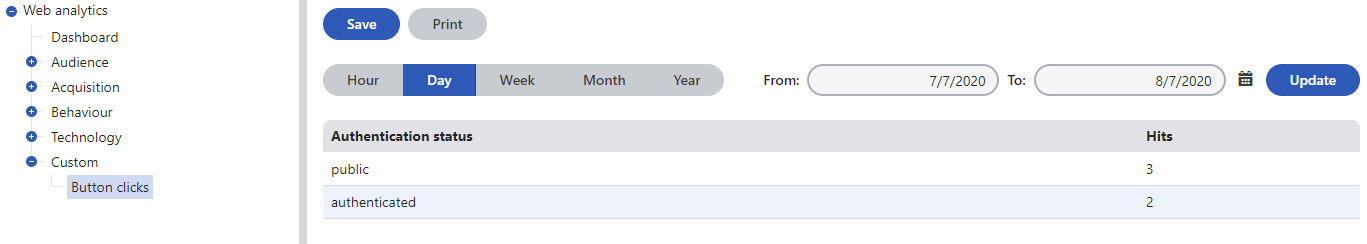
Result
Once there are some hits logged in the database for a custom statistic, the system automatically displays the statistic under the Custom category of the tree in the Web analytics application. The reports of the sample statistic show the number of hits logged for the tracked button click event.