
Debugging the application cache
If you encounter unexpected caching behavior or any problems related to the cache, you can use the system’s debugging functionality to:
- Check the exact content of the application’s cache
- Monitor caching operations for web requests
You can access the debugging interface through the Debug application.
Viewing the stored cache items
To browse the contents of the application cache, select Cache items in the debugging interface and open either the Live site or Administration tab.
On the tabs, you can see which Data items and Dummy keys (cache dependencies) are currently stored in the corresponding application’s server-side cache.
When browsing cached items stored in the server-side cache of the live site application, you may encounter records with the UnknownTypeDictionary data type.
Certain objects are typically only available on the side of the live site application (e.g., generated page type classes). The UnknownTypeDictionary is a generic key-value data type used to store and represent such objects in the administration interface.
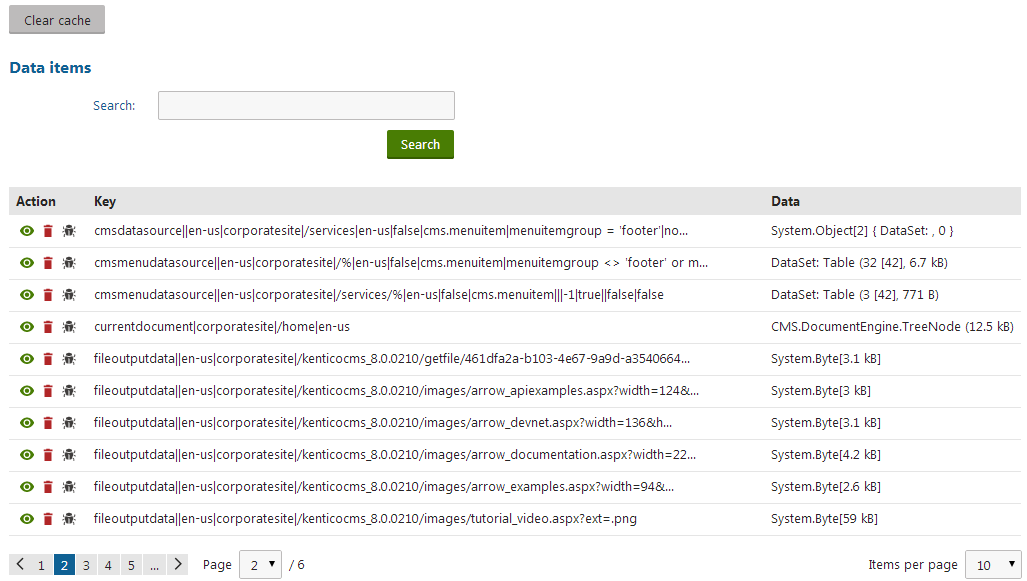
Clicking View () next to a cache key opens a new window showing detailed information about the cached object:
- Key – the key under which the object is stored in the cache.
- Expiration – date and time when the cache item will expire (i.e. will be removed from the cache).
- Priority – Xperience uses two priorities for cache items: High and NotRemovable (will not be deleted from the cache as the server frees system memory).
- Dependencies – list of dummy keys on which the cache item depends. The system removes the cache item if any of the dummy keys are touched (modified).
- Object type – the type of the cached item.
- Fields – the fields storing the actual data of the cached item (depend on the item’s object type).
When browsing the administration application’s cache (on the Administration tab), you can perform these additional actions:
- delete individual cache keys by clicking Delete () next to the corresponding items.
- remove all items from the cache via the Clear cache button.
- find out more information about a cached object by clicking Debug () next to the item in the list of cache keys. Debugging cache keys allows you to browse the full system data of the given object, including all properties, variables and related objects.
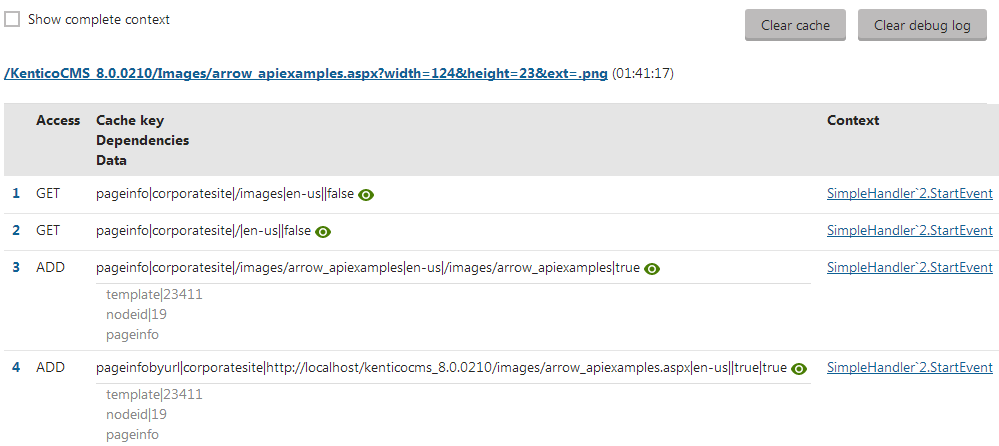
Debugging cache access
The cache access debug allows you to view the cache operations that the administration and live site applications perform for individual web requests (adding items to the cache, loading data from the cache).
Enabling the cache access debug
To use cache access debugging, you need to adjust the settings in Settings -> System -> Debug:
Setting | Description |
Enable cache access debug | Enables cache access debugging and the Cache access tab in the Debug application. |
Debug cache access of UI pages | If enabled, the cache access debug also covers requests for pages of the administration interface. Requires cache access debugging to be enabled. |
Cache access debug log length | Sets the maximum length of the cache access debug log on the Cache access tab of the debugging interface, i.e. the number of requests for which debug information is preserved and displayed. If empty, the value of the Default log length setting is used. |
Display stack information | If enabled, the system tracks the code stack when debugging cache access and displays the information in the Context column. This information is only available in the debugging UI and on the live site, not in the debug log written into the logcache.log file. |
Log cache access to file | If enabled, the system saves the cache access debug log into the logcache.log file in the ~\App_Data folder. This option does not require cache access debugging to be enabled. |
Tip: You can also enable cache access debugging through the “debug everything” settings in the All section of the Debug settings category.
Monitoring cache access
To view which cache operations the system performed for recent web requests:
- Open the Debug application.
- Select Cache items in the debugging interface and open either the Live site or Administration tab.
You can see the URLs of web requests and the time when the system processed the requests. The table below each request contains the cache items that the system accessed during the request. The table provides the following information for each cache item:
The type of Access (Get, Add)
The name of the accessed Cache key
The cache item’s dependencies
The object type and size of the cached Data
The Context in which the cache item was accessed (API method)
- Click on the method to see the stack trace of the cache access
- If you enable the Show complete context option at the top of the interface, the stack trace is displayed for all cache items.
Clicking View () next to a cache key opens a new window showing detailed information about the cached object:
- Key – the key under which the object is stored in the cache.
- Expiration – date and time when the cache item will expire (i.e. will be removed from the cache).
- Priority – Xperience uses two priorities for cache items: High and NotRemovable (will not be deleted from the cache as the server frees system memory).
- Dependencies – list of dummy keys on which the cache item depends. The system removes the cache item if any of the dummy keys are touched (modified).
- Object type – the type of the cached item.
- Fields – the fields storing the actual cached data (different for each object type).
When monitoring cache access for the administration application (on the Administration tab), you can perform these additional actions:
- remove all records in the cache access debug by clicking Clear debug log.
- remove the actual data from the system’s cache by clicking Clear cache.