Debugging SQL queries with Glimpse on MVC sites
Kentico Xperience Refresh 1 introduces SQL debugging functionality integrated directly into the administration interface. The Kentico.Xperience.Glimpse package remains available and you can use it if you wish to see executed queries as they occur on the live site. However, we recommend using the built-in SQL debugging functionality, which does not require additional configuration.
During the development of your websites, you may want to see which SQL queries run when loading specific pages. For ASP.NET MVC 5 applications, you can debug the executed SQL queries using the Kentico.Xperience.Glimpse integration package.
The Glimpse integration package is NOT supported for applications using the ASP.NET Core development model.
Setting up Glimpse in the MVC 5 application
To use Glimpse in your MVC 5 application, install the related NuGet packages and enable Glimpse:
- Install the required NuGet integration packages:
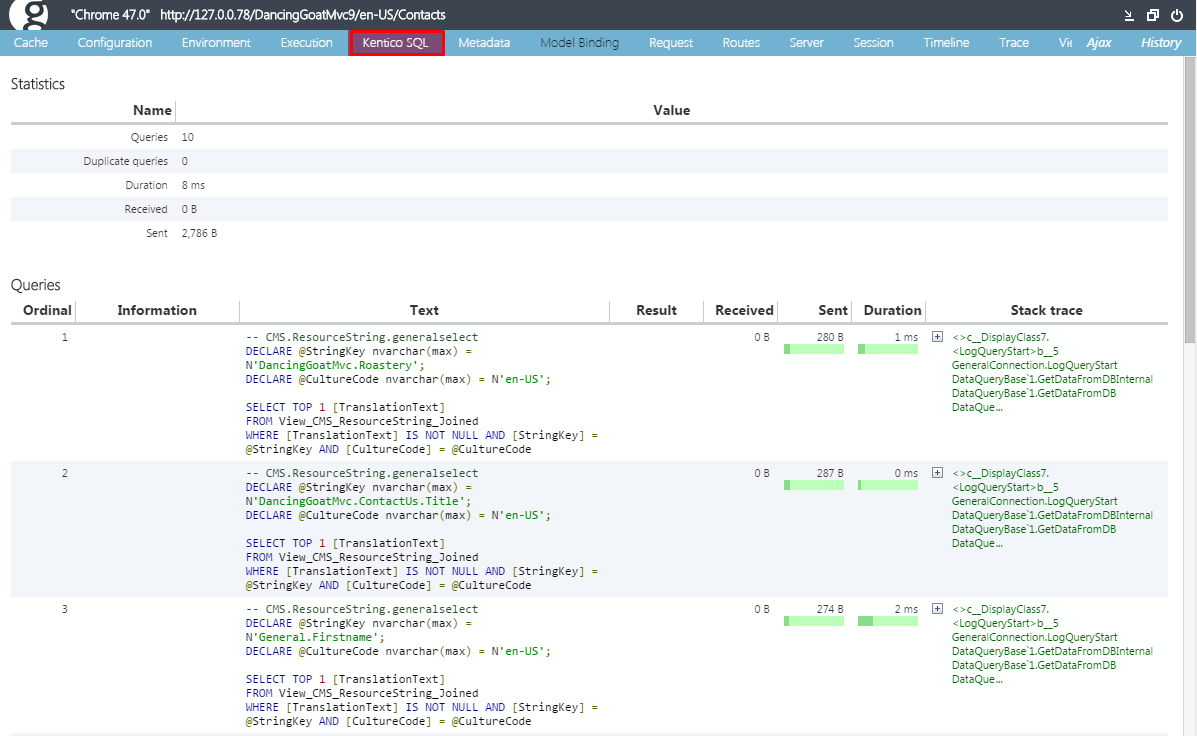
- Kentico.Xperience.Glimpse – adds the Kentico SQL tab, which provides insight into the SQL operations that the related Xperience instance is performing.
- Glimpse.Mvc5 – adds the following tabs, which provide diagnostics specific to the ASP.NET MVC 5 framework:
- Execution
- Model Binding
- Metadata
- Views
- Run the MVC application and navigate to /glimpse.axd.
- Click Turn Glimpse On.
The Glimpse extension is now enabled and you can use its web diagnostics features.
By default, the Kentico SQL tab in Glimpse does not show any information. You need to enable SQL debugging in the Xperience settings to populate the tab:
- Open the Xperience Settings application.
- Navigate to System -> Debug.
- In the SQL queries section, select the Enable SQL query debug option.
- Click Save.
At this point the Kentico SQL tab in Glimpse shows the information about executed SQL queries. You can find the following information for each query:
- SQL code of the query.
- Size of the data that was Sent and Received.
- The Duration of the query execution.
- The full Stack trace of each query.